Schools
Is Gov. Brown Right to Dole Out Money to Marin's Public Schools Unequally?
Compare per-student funding for Marin County schools. You may be surprised.

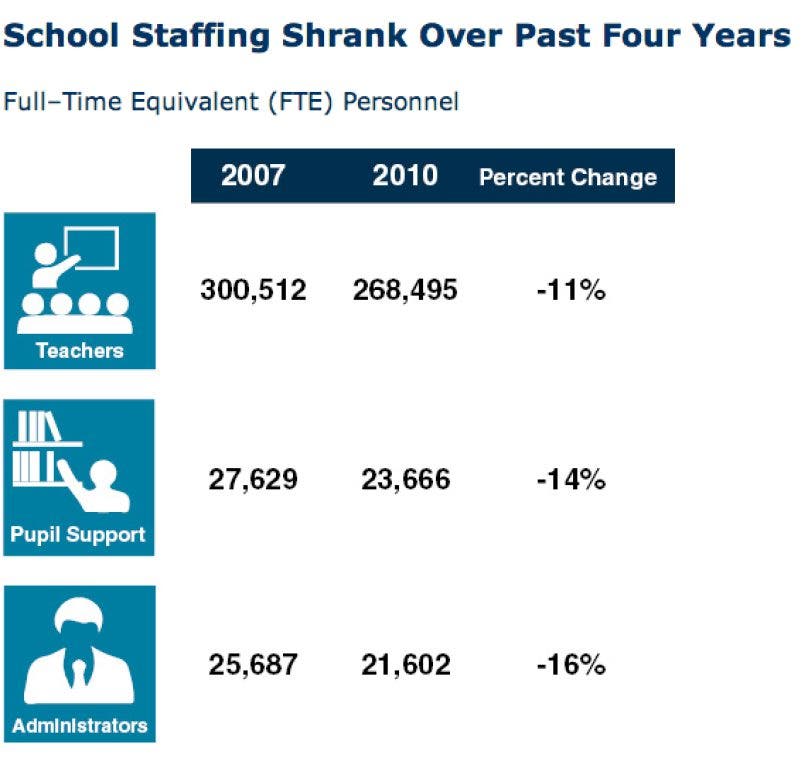
This is what California public education looks like after the Great Recession:
Between 2007 and 2010, the number of teachers in the state's K-12 classrooms shrunk by 11 percent. Reading specialists, librarians, and other school employees helping students learn declined by 14 percent. Front offices took the hardest blow, with the number of administrators dropping by 16 percent. All these cuts hit schools even as the total enrollment held steady at around 6.2 million students.
Now that California is looking at its first budget without a deficit in five years, Gov. Jerry Brown's budget calls for restoring some money to the state's public schools. But, he does not want to distribute the money equally.
Find out what's happening in Mill Valleywith free, real-time updates from Patch.
[For differences in revenues between Marin County school districts during the 2010-11 school year, see the tables at the bottom of this article.]
"Aristotle said, 'Treating unequals equally is not justice.' And people are in different situations. Growing up in Compton or Richmond is not like it is to grow up in Los Gatos or Beverly Hills or Piedmont," Brown said, according to the San Francisco Chronicle.
Find out what's happening in Mill Valleywith free, real-time updates from Patch.
There are already big differences in the sums school districts get from the state.
Consider two very different communities in Marin, Mill Valley and Novato. In the 2010-11 school year, the Mill Valley School District received $10,895 for every student. The Novato Unified School District received $8,575 per student.
But while $3,908 of Novato's per-student funding came from the state, Mill Valley received negative-$25 per student due to so-called state "take-backs." That’s largely because of the different revenue structures for those two districts. As a basic aid district, Mill Valley receives the lion's share of its revenue, or $5,604 per student, from local property taxes. It also receive $4,443 per student from its annual parcel tax, which was increased by voters in the November 2012 election.
By contrast, Novato is a revenue limit district, receiving nearly half of its revenue from the state.
Under Gov. Brown's proposed budget, which has $3 billion more than last year for K-12 and community colleges, underprivileged schools would get more per-student funding than other schools. That means that funding would be weighted towards those schools with higher percentages of English language learners and the number of students who receive federally subsidized lunches for low-income residents, according to Marin County Office of Education officials.
The differences in those areas within Marin are stark.
For instance, while the Ross Valley Elementary School District recorded 3.1 percent English Learners in the 2009-2010, the San Rafael City Elementary District recorded 51.5 percent English Learners.
"Our future depends not on across-the-board funding, but disproportionately funding those schools that have disproportionate challenges," Brown said in a press conference last week.
Will Gov. Brown's proposed shift in funding be enough to bridge the economic gap that contributes to the achievement gap? Does more money improve student performance?
0% Local Property Taxes $6,273 317% Federal Revenue $373 40% Other State Revenue $801 54%
Other Local Revenue (includes parcel taxes) $2,100 286% Total $9,400 111%
Mill Valley Elementary School District Revenue for 2010-11
Source $ Amount per student % Statewide average for elementary school districts State Aid -$250% Local Property Taxes $5,604 283% Federal Revenue $316 34% Other State Revenue $556 38% Other Local Revenue (includes parcel taxes) $4,443 605% Total $10,895 129% Novato USD Revenue for 2010-11 Source $ Amount per student % Statewide average for unified school districts State Aid $3,908 114% Local Property Taxes $1,378 71% Federal Revenue $550 49% Other State Revenue $1,187 60% Other Local Revenue (includes parcel taxes) $1,552 292% Total $8,575 95% Ross Valley Elementary SD Revenue for 2010-2011 Source $ Amount per student % Statewide average for elementary school district State Aid $3,672 110% Local Property Taxes $1,539 78% Federal Revenue $287 31% Other State Revenue $965 65% Other Local Revenue (includes parcel taxes) $2,197 299% Total $8,660 102% San Rafael City Elementary SD Revenue for 2010-11 Source $ Amount per student % Statewide average for elementary school districts State Aid $3,474 104% Local Property Taxes $1,594 81% Federal Revenue $894 96% Other State Revenue $1,660 112% Other Local Revenue (includes parcel taxes) $1,665 227% Total $9,286
110%
San Rafael City High School District Revenue for 2010-11 Source $ Amount per student % Statewide average for high school districts State Aid $602% Local Property Taxes $9,702 308% Federal Revenue $578 65% Other State Revenue $370 25% Other Local Revenue (includes parcel taxes) $2,092 295% Total $12,802
131%
Tamalpais Union High SD Revenue for 2010-11Source $ Amount per student % Statewide average for high school districts State Aid -$69 0% Local Property Taxes $11,792 374% Federal Revenue $395 44% Other State Revenue $529 35% Other Local Revenue (includes parcel taxes) $3,595 507% Total $16,241 167%
Source: California Department of Education, Ed-Data
Get more local news delivered straight to your inbox. Sign up for free Patch newsletters and alerts.